Surf Program Introduction is given further down the page following the first example. The program overview and links to the procedures page and the more examples page. Help Page
First Example
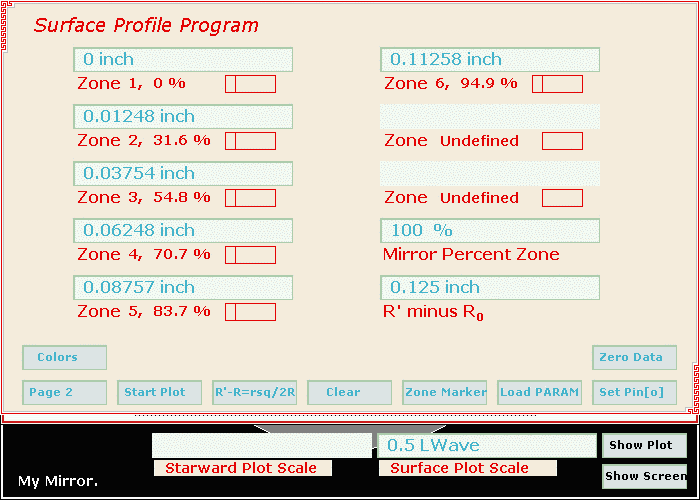
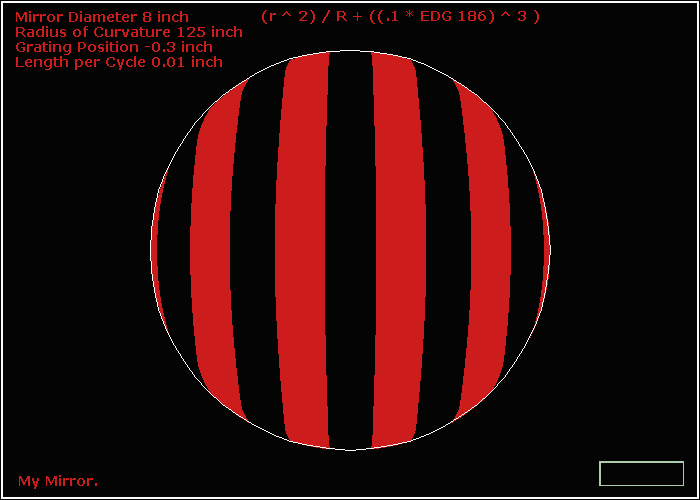
We are figuring a 10 inch, F5 mirror. The Ronchi test outside of focus shows a turned down edge. Using the knife edge and the pin stick we carefully find the knife edge setting for the 70 percent zone and record the reading of .062 inch from the micrometer. Moving the knife edge toward the mirror with the micrometer we find the setting for the 30 percent zone and record the reading of .012 inch. Then moving the knife edge away from the mirror we find the setting for the 95 percent zone and record a reading of .156 inch. On our tester the light ( slit ) moves with the knife edge.
How much is the edge of the mirror turned down? How is the wave front affected by the turned edge? Where should I polish the hardest to correct the problem?
1. Click on the upper third of the icon above to start the Surf Program and wait for the program to load and compile. Using some versions of Microsoft Internet Explorer you will receive several security warnings which you must click through before the program will load. At this time, Jan. 07, Mozzila Firefox browser which can be downloaded for free will not give warnings for the Surf Program Applet.
Options, keep the Surf program running on a tabbed selection or a 'separate instance' of Internet Explorer while you browse the instructions.
We do not recommend changing browser default security settings to get rid of the security warnings.2. It may be useful to click on the browser's field then press F11 or select 'view' then 'full screen' in the new browser window.
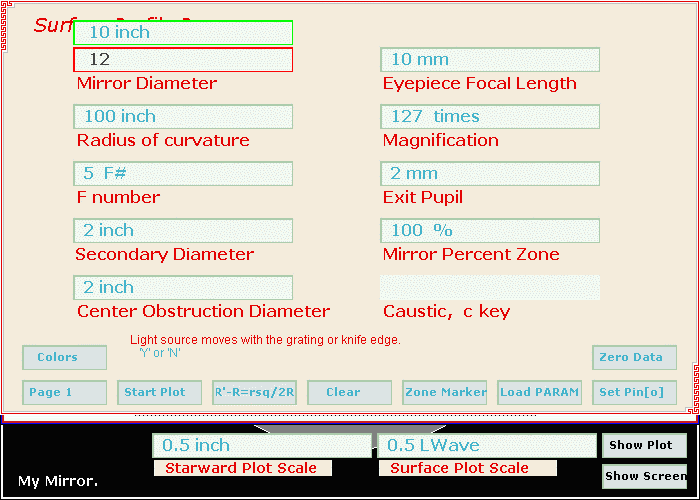
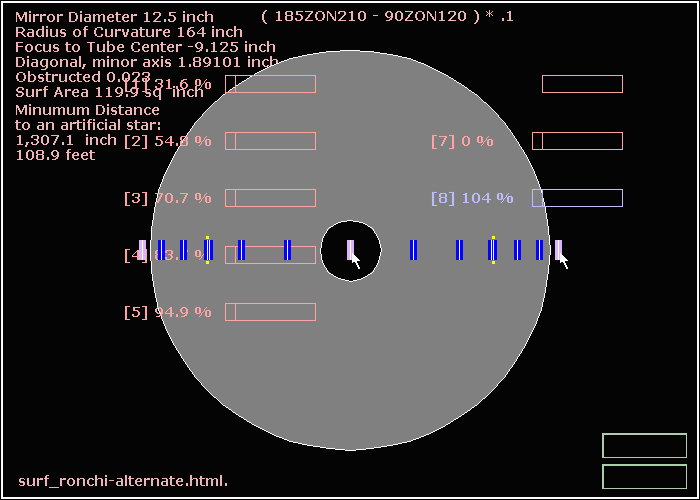
Refer to the pictures at right for the following instructions.
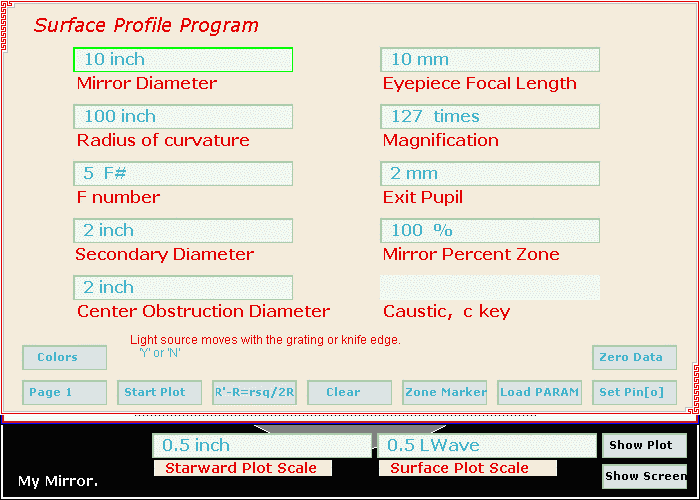
3. Press the page button to view page 1 of the program. Check to see that the mirror diameter is set for 10 inches and the 'Radius of Curvature' is set for 100 inches, F number, F5. Press the page button again to return to page 2.
( 'Press' means left click or hover + 'Enter' )
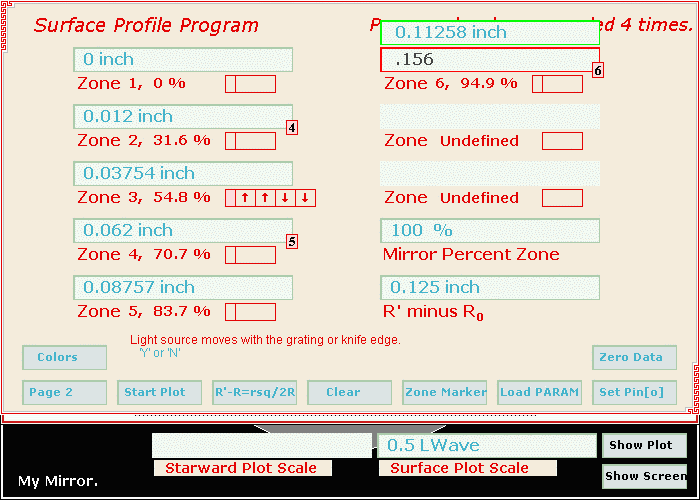
5. Enter .062 at the entry for the 70.7 percent zone.
6. Enter .156 at the entry for the 94.9 percent zone.
7. Press the clear button once.
8. Press the 'Show Screen' button.
9. Press the top left button on the white plot board. The legend at the top of the plot board should read "Data from ROC Measurements" while the mouse cursor is hovering over the top left button.
10. Click on the third button down on the left side of the plot board. The legend at the top of the plot board should read "Mirror Surface Profile minus Reference Surface Profile" while the mouse cursor is hovering over the third button.
If the wedge test pattern is visible press the top button then the third button again. Or press the w key on the keyboard. Note that the Applet will not receive the w key unless you have clicked on the applet background.
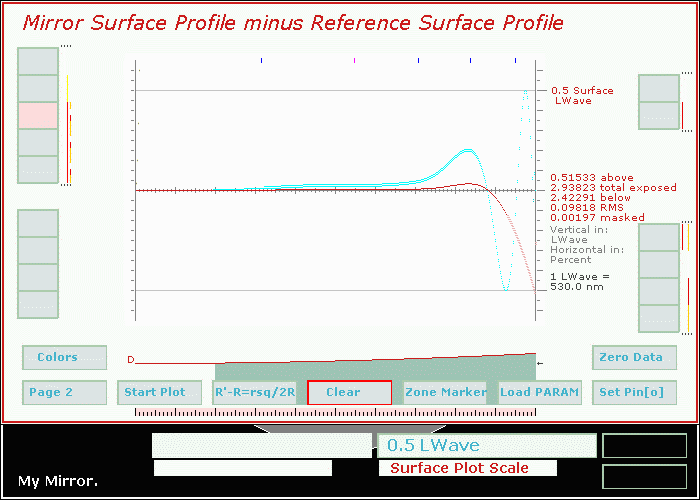
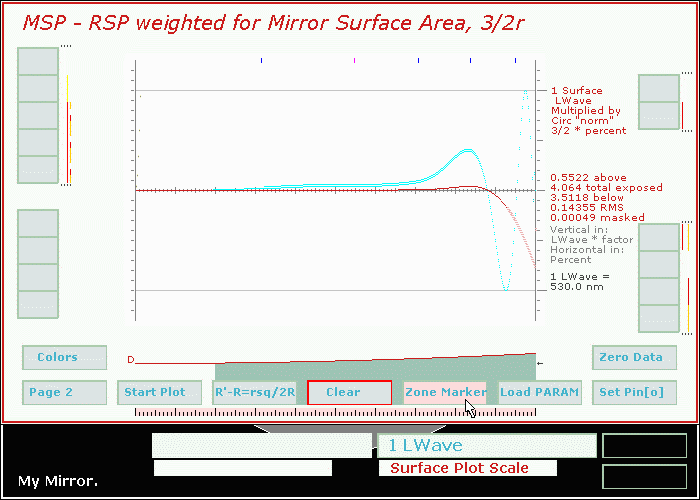
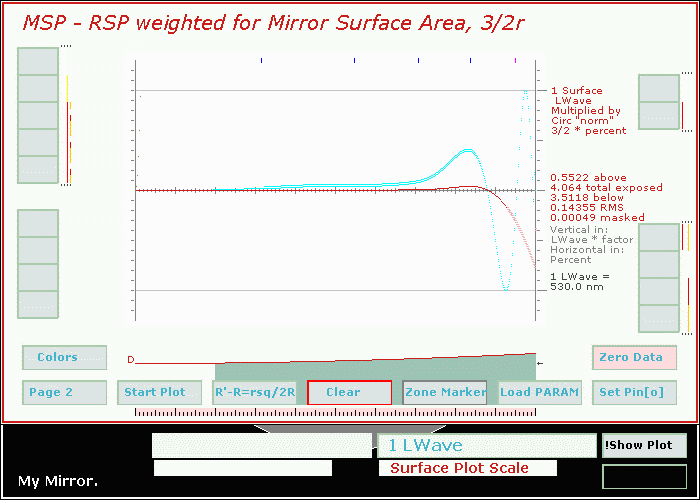
The graph in the plot board shows 1/2 wave of turned down at the mirror edge in red-brown color and one full wave of 'wave front error' at the mirror edge in cyan color.11. Click on the fourth button on the left side of the plot board. The legend at the top of the plot board reads "MSP - RSP Weighted for Mirror Surface Area, 3/2r" when hovering over this button. The plot runs off the bottom of the graph on the right side.
12. Set the 'Surface Plot Scale' which is below and to the right of the plot board to 1 Lwave. Note, depending on browser settings 'Surface Plot Scale' selector may be below the bottom of the display screen so you may need to use the browser's scroll bar. During the time that the mouse cursor is not over the Surf Applet's image you may see gray areas because the Applet's image is not refreshing.
13. Press the 'Marker' button.
14. Hover the cursor over the 94.9 percent zone marker as shown in the picture at right to obtain the focus for it.
15. Click on the 'Show Plot' button. ( See note for step 12. )
16. Click on the 'Zero Data' button. ( PBL4 had been selected above, step 11. )
Both the unknown curve and the reference parabola are zeroed at the selected 94.9 percent zone pin. Only the unknown curve minus reference curve plot is seen because of the 'Surface Plot Scale' setting.17. Click the fourth button on the left to clear the previous display.
Since there is no way to put glass back at the mirror edge it appears we will need to remove quite a bit of glass in the 60 to 90 percent zone.
Program Overview
Page one is similar to the Ronchi program data entry page. The Ronchi/Foucault selector becomes the data entry page selector in the Surf program.
On page one the knife edge position becomes 'Secondary Diameter'. Positive entries here are echoed in the 'Center Obstruction Diameter' box. Negative entries in the 'Secondary Diameter' box cause the box function to change to 'L' value.
The diameter of the unobstructed field at the focal plane of the primary, which is needed for this calculation, is permanently set to .5 inch in the Surf program.
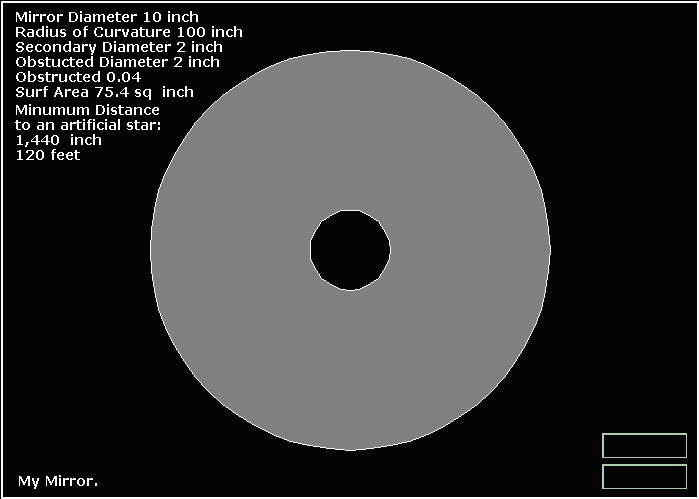
The black background page which showed the Ronchi or Foucault plot in the Ron Program now has a calculation for minimum distance to an artificial star. The distance is given in feet since the formula given in the 'Sky and Telescope' article produces a result in feet. The distance is also given in the same units as in use on the mirror diameter data entry box.
The smaller silhouette in the center represents the shadow of the center obstruction.
The white background 'plotting board' page did not exist in the Ron Program. The page plots either the starward ( knife edge ) measurements or the mirror surface profile derived from those measurements. The result of the Rxy - Ro formula and formula parser may also be plotted or used in various ways.
Users measured knife edge data is entered on data entry 'page two' of the program or more likely directly into the PARAM(s) in the surf.html file with the use of 'NotePad' or other text file editor.
The user is not likely to have radius of curvature measurements for the mirror center, 0 percent zone, or for beyond the mirror edge, 104 percent zone. You will need to make entries for these zone to make the curve fitting method perform with the greatest accuracy ( fit a true curve ). The 'Set Pin [o]' button will call the 'set_data_for_marker_pin_0_to_the_curve()' 'method' to set pins at zero percent and 104 percent if there are not already pins set to those radii when the 'method' executes. The procedure derives from the 'Tele Topics' article. Unless your knife edge measurement are accurate to better than .001 inch then careful curve fitting may not be necessary.
The Surf Program maintains an array of 400 double precision numbers which will always fit the users data entries. Selecting the second button on the left side of the plotting board will cause the program to request a starward reference array. If the reference array is not available ( is null ) and auto_recalc PARAM is set to "true" the program will press the 'Start Plot' button for you and fill the starward reference array. The starward reference array is filled with the r_sq/2R calculation by default if the formula selection has not been changed.
<!-- If it is necessary to parse the above formulas to provide program parameters. -->
<!-- true OR false, false = prompt user, true = recalculate without prompt. -->
<PARAM NAME=auto_recalc VALUE="true" -->
If the reference array was 'null' you will need to press the second button on the left again after the array has been filled. The users entered data array minus the starward reference array will then be plotted. The vertical plotting scale may be changed at the 'Starward Plot Scale' data entry box which is at the left bottom of the Applet.
Pressing the third button on the left will initially cause a test surface plot to be generated. Pressing Esc or pressing the top left plot board button will cause the test display to cancel. Or you can cycle the test display on and off with the 'w' key on the keyboard. When the third button on the left is pressed the program will transform the users data into a mirror surface profile. The vertical scale of the mirror surface profile may be changed using the 'Surface Plot Scale' data entry box at the bottom right of the Applet. At the same time the program plots the surface profile it also plots the surface profile minus the surface reference profile. The default surface reference profile is the formula for a parabola. So the user then sees plotted the surface error of the mirror. The surface reference array is selected via a grouping of four buttons on the right of the plotting board. The four selections are: 'Transform of Starward Formula', 'Parabola Surface Formula' (the default), 'Sphere Surface Formula' or starward 'Formula used as a Surface Reference'. The starward formula as a surface reference will require the user to edit the surf.html file and place a surface reference formula there for the program to parse in place of the normal 'Starward' formula. The starward 'formula_as_a_surface[]' array is loaded by a right mouse click on the 'Formula used as a Surface Reference' button. ( The lower of the group of four buttons on the right side of the plot board. ) The 'formula_as_a_surface[]' array will not be nulled or updated if mirror parameters are changed by the user. The only way to null the 'formula_as_a_surface[]' array is to restart the program or hold the x key on the keyboard down and then click the 'Clear' button twice. Changing tester 'Light Source Moves' Y or N will also null 'formula_as_a_surface[]' and many other arrays.
'Plotboard' Button Alert Lines
You will see colored vertical lines to the right of the plot-board buttons. These lines indicate that the status of the data used by that button may have changed. When the needed 'method' executes the colored line will be over drawn with a white line. A key for the 'alert lines' is in the file alert_lines.htm. The alert lines are useful because sometimes the computer may be receiving email or doing some other high priority job and without the alert line you would not know the needed method had not executed.
Starward to Surface Transform Method
The staward to surface transform begins at the mirror center and tilts a mirror 1/400 of the mirror radius at such an angle that a ray of light from Rxy will be reflected back to Rxy. Ro is the radius of curvature of the mirror center. Rxy - Ro depends on a distance from the mirror center rxy. The values for Rxy were stored in a 400 element array of numbers called 'curve to fit data'.
The mirror tilt calculation uses formulas available in high school level trigonometry. The transform runs inside a 'for loop' and the second 'mirror' at position 2/400 is attached to the outside end of the first mirror and tilted to reflect the ray from starward array element [2]. And so the transform proceeds to the mirror edge. The generated surface is not smooth and due to not being continuous is not exactly accurate. More information on this.
If the auto_recalc PARAM is set to true the program will calibrate the transform method by inputting to it a known starward formula and comparing the output to a known surface formula and then fill the 'transform_correction_array[]' with the difference between the true surface and the sample transformed surface. The 400 element correction array then adds to the subsequent 'unknown' surface array elements to produce a mirror surface profile that is extremely accurate.
There are three surface correction arrays. One is for parabolic, one is for spherical and the third is for a custom calibration set up by the user. The custom calibration is available on the 'Transform of starward formula' selection and the 'Formula as a surface reference' selection. If the user has not set up the custom calibration the program will automatically use the parabolic correction array for all choices except the spherical reference which has its own correction array. ( One of the three, as above. )
In order to better maintain calibration of the starward to surface transform method it is necessary that the 'mirror center', curve_to_fit_data[ 0 ], starward array entry be zero. If the users starward data points do not produce a curve that is zero at the mirror center then the transform method will detect this and subtract or add the same offset to all 400 elements of a copy of the input starward array in order to zero the curve at the mirror center before performing the transform.
The 'starward' and 'surface' scale data entry boxes can be set to any value to produce a plot of any scale. However if you want a grid and scale legend to be drawn for your plot then the scale entry must be set to some multiple of ten of .00000000002, .00000000005 or .0000000001. Valid entries for example would be 2 Lwave or .005 mm or .001 mile.
The "Caustic" data entry box on page one is used to obtain values for the mirrors caustic curve. The c or C key on the keyboard will actuate this feature and toggle its display.
Note that keyboard entry won't work until the mouse has been clicked on the Applet's field.
Procedures
Below are links to examples showing the use of the Surf program.
Three pin
Three pin is similar to 'Example 1' but has different data entered in advance. Also the light source is presumed to be stationary and not to move with the knife edge as in example one.Using a Mirror Surface Formula as a Mirror Surface Reference
demonstrates the programs ability to use a surface reference other than the default parabolic surface reference.'Quantify' a turned Edge
If my Ronchi-gram looks like the example of turned edge in the Ron program how much is the edge lowered in waves and how is the wave front affected.Precision Calibration of the Transformer Method for Non Parabolic Mirror Plots
Testing a precision ellipsoidal mirror for use at 300 nm.Simulation of Atmospheric Turbulence using Random Numbers
Compare the effect of mirror surface errors to the effect of turbulence.Prepare a table of Caustic X and Y Values for the test described in ATM Book Three
What does a parabolic curve look like.
How is a parabolic curve different than a sphere.Program/User interface Problems
More Examples using actual test data from peoples mirrors.
Return to alt_13.htm
Introduction
Surf Program is used to provide the mirror maker with knowledge about the mirror's surface and the wave front. And how various measured errors in mirror radius of curvature affect the mirror surface and wave front.
The
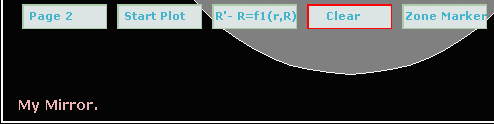
The panel at right has three buttons. The top button starts the Applet which is not on this web page. The other buttons take you to locations on this page.
Save documents and close other programs that are running on your computer.
Start the Surf Applet by selecting the top panel in the picture above right. After some delay depending on down load time and your computer's speed you will see sample mirror PARAM s flash on the browser status bar. The status bar is shared by the browser and the applet. Some of the information on the status line will come from the browser during startup.
After the applet has finished loading the status bar will display: "Legend slide " or "Click mouse on the Applet area to activate keyboard." or "Applet sleeping, move mouse to awaken" or "The mouse cursor is not over the applet". See picture at right.
The entire applet won't be visible in some browser display modes so if you will be capturing the computer screen to a file for printing you should click 'View' and select the 'Full Screen' option from the browser menu.
After selecting page 1 at the bottom left, the applet should appear as the picture at right. Lets say your mirror is a 12 inch mirror with a radius of curvature of 100 inches. Put the mouse cursor in the data display box above 'Mirror Diameter'. The box border should change color to show that it has focus. Click the left mouse button or press 'Enter'. The border of the box should go black momentarily as the command is accepted. The data display box will move up and a data entry box will appear where the data display box was previously. Press 'Backspace' until only the 1 remains. Press 2.
The applet should now appear as the picture at right. Next press 'Enter' or press the left mouse button. The applet should show 12 inch above the heading 'Mirror Diameter'. Repeat as above for other mirror properties.
The program's display has page 1 data, page 2 data and the black background behind. The white plot board is pasted on top of the black background and behind the data pages and data buttons.
Controls for the display layers are 'Clear' button, 'Show Plot' button and 'Show Screen' button. The 'Clear' button also has the job of clearing the program and display, much as the clear button on a calculator. The first click of the clear button is used to see behind the cream colored title and legend image. The 'Clear' button will then have a red border. Clicking the clear button when it has a red border will clear the programs variables ( excluding mirror's properties ) as well as erase any plotting. If you are uncertain of the Surf status then 'Clear' will let you start over. The 'Show Screen' button function depends on the state of the 'Clear' button. If the 'Clear' button has a red border then the 'Show Screen' button selects between data entry buttons visible or not visible. Otherwise the 'Show Screen' button selects between data entry page and no data entry page overlay. 'Show Plot' turns the white plot board on and off. To return to the data entry page without clearing Surf press the Esc key.
Making a Printout of the Screen
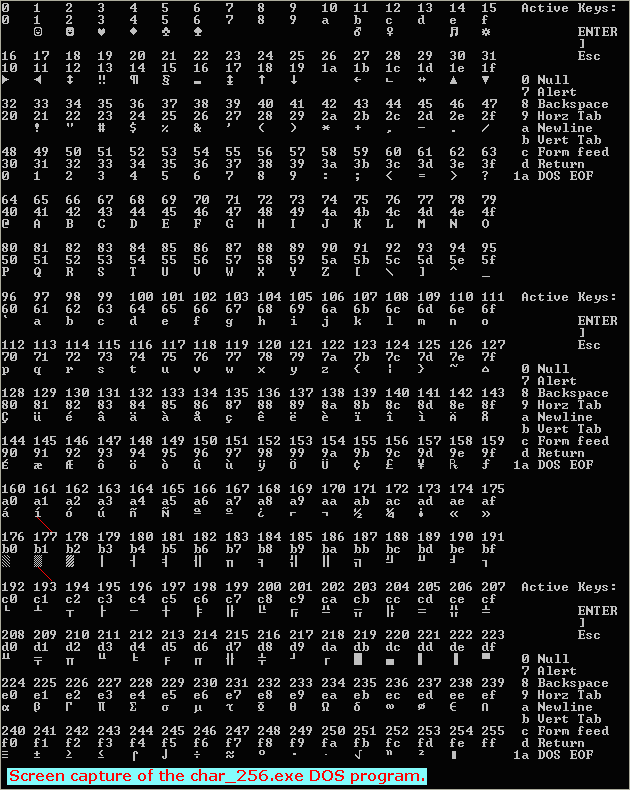
The Java 'Image' data type depends on the operating system, PC or Mac or other. This makes an image capture in Java a bit tricky at least at present. Also our Java application is operating inside a browser and thus will require a special certification to allow the applet to write a file onto your computer's hard drive. However there is an alternative.
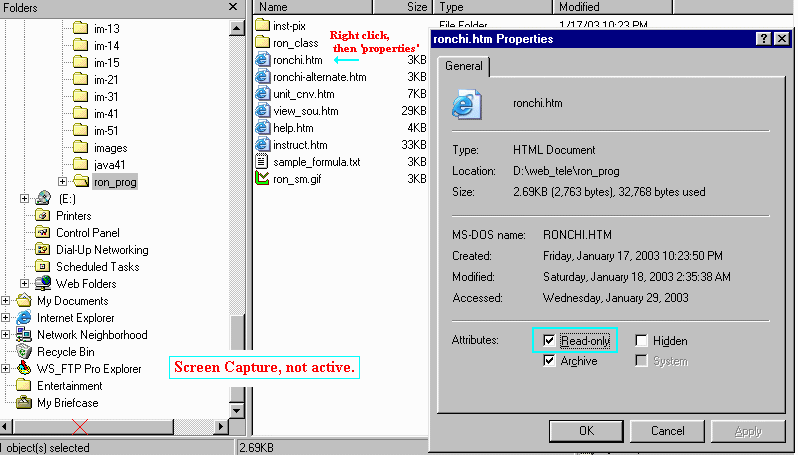
To save the screen when using Microsoft Windows 95/98/XP you will need to download third party software. The type of program is called a screen capture program. The screen capture program runs on your computer outside of the browser environment. When activated it will capture whatever happens to be on the computer's screen, apparently directly from screen memory. The screen capture program will allow you to save the image in whatever file format you like, .jpg .gif etc. Then you can print the image file, attach it to an email or whatever. I have been using a program called PrintKey for screen capture. Screen capture is available without third party software in some later operating systems.
Running the Applet on Slow Computers
The Surf Java Applet was written on a 250 mHz computer running 'Windows 98'. As the program grew most of the testing was done on a Dell 5100 notebook running 'Windows XP' at 2 gHz. ( Video mode 800 x 600 ) 'Sun Microsystems' can provide a free 'Applet Viewer' which can be downloaded from 'Sun Microsystems'. The Surf program runs best on the Dell 5100 using the Microsoft browser or Firefox browser. Surf has not yet been tested on Apple and Linix operating systems. The Surf program seems to use a lot of 'stack' space, a type of memory that is usually on the CPU chip. If there is insufficient stack space older processors will hang. This will not hang the computer and the program can be dumped using Ctr, Alt, Del and selecting end task. Newer systems will use the swap file on the hard disk to handle stack overflow. Operation using stack buffering to hard disk will run too slow to be practical. Sometimes re starting the program will clear the problem. As with any computer the more programs that are running the longer it will be before the computer's processor returns to service the browser and the more stack space will be in demand. Beyond experimenting with the Surf program most users will find it easier to enter mirror parameters directly into the .html file. Always keep a backup of the original file in case your copy of the original becomes corrupted. 'Microsoft Notepad' and many other text editors can edit text files. To open an .html web page file with Notepad select 'File', 'Open', then select 'All Files ( *.* )' then you will be able to see the surf.html file in the selection box. If you have copied the 'surf_prog' folder from the 'Telescope Program' C/D to your hard drive it is likely that all the files have been set to 'read only'. To change the 'read only' attribute open Windows Explorer and uncheck the read only attribute in the properties box. Only the file in which you enter PARAM s will need the attribute changed.
Browsers are very picky about running applets and for good reason. By the time the browser finishes checking the applet you may think the computer has hung. If it just takes too long and you want to quit the applet then hold down Ctrl, Alt and Del at the same time and Windows will give you a chance to dump the applet from processing in memory. Although the program has been tested with the usual types of mirror data there are too many variables to test every possibility. Best to save documents in other programs to the hard disk and shut down all but the browser before you start the applet. When the browser loads an applet either from a C/D or from the internet it converts the universal Java code in the Java.class file into code that will run in the local host computer. If you browse many Java applets on the internet the browser will store more local code for each applet. The browser handles local compiled Java code differently than it handles web pages. Pressing 'Refresh' will re-initialize the Java applet but will not dump and reload the local Java code store. Closing the browser will get rid of the local stored Java code compiled from the Java.class file.
The Mozilla Foundation's Firefox Browser runs Java Applets easily and is referenced on the Sun Microsystems website. The Firefox Browser is available for multiple operating systems and languages.
Current issues with the Surface Profile Java Applet
When the program has been uploaded to an ISP provider then run at a public library computer it is not possible to dump the local Java memory store without closing the library's internet browser. Most libraries do not allow users to close the internet browser.
The Surf program uses quite a bit of 'stack' space. The Java Applet Viewer version you are using may not allocate enough stack space for the Surf program to operate. ( October 2004 ) This may cause the program to hang requiring Ctrl, Alt, Del keys to cause the operating system to dump the Surf Applet and Applet viewer. In older browsers the operating system handles the overflow by buffering the overflow to the hard disk swap file. Under this condition, although the program is not hung it will run so slowly that it will appear to be hung. Newer computers and operating systems don't seem to have a problem.
Instruction Detail
Data Entry Buttons
Page One 'Mirror Diameter'
Put the mouse cursor over the button for focus.
Press left mouse button or 'Enter' key for data entry.Press 'Esc' or move the mouse away to cancel data entry.
Active keys for data entry: 1, 2, 3, 4, 5, 6, 7, 8, 9, 0, - and . and Backspace and 'Space Bar'.
Use the - key to change the sign of a number.
Most other keys will blink then be rejected.
Press left mouse button or 'Enter' key to complete data entry.
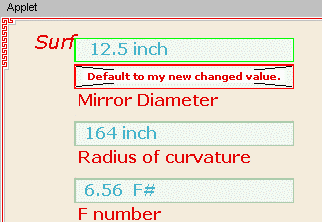
If you want to change the default mirror diameter without editing the .html file place the mouse cursor over the data entry button and 'left mouse click' as if you planned to change the entry. Then 'left mouse click' on the box above the data entry box. The display will show "Default to my new changed value." momentarily as the data entry cancels. See picture at right. Thereafter the program will show your new value in the data entry box for you to edit next time. This is useful, for instance, if you want to make small changes in a value without re entering the entire number. If the program is re started it will re initialize from the .html file or from default values that were set in the Java.class code file.
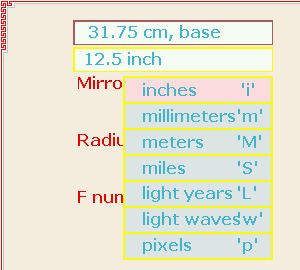
This program is able to accept length data entry in the following units:
'M' meters
'm' millimeters
'w' light waves
'i' inches
'S' miles
'A' astronomical units
'L' light years
To change the units:
Press the right mouse button to obtain the display at right.
If your setup won't accept 'right mouse button' press \ instead.
To cancel the display shown at right press 'Esc'.To see the present length in another unit of length run the mouse cursor over the units of 'length units selector box'.
To accept another system of units put the mouse cursor over the desired units and press 'Enter'. If you want to use the program mostly for converting units you can set a PARAM in the .html file to allow you to see more significant figures to the right of the decimal point.
The 'nnn cm base' data display box visible while 'length units selector box' is active will always display the mirror diameter in centimeters. 'Base' refers to the fact that length values are stored in this program in units of cm.
All length data input to the program is converted to cm first then to the other units as required for display. All calculations internal to the program are done in cm or screen pixels.
Light wave is set to 530nm, ( nanometers ) with a PARAM in the .html file. If you want to know your length in a wave length in the infra red the PARAM can be changed and the program re started.
While the system of units box is being displayed you can start a screen saver type of display by pressing 'Shift ~'. To cancel the screen saver display press 'Esc'.
'Radius of Curvature'
The 'Radius of Curvature' data display and entry works the same as the 'Mirror Diameter' data display and entry.
'F Number'
The 'F Number' is a 'dependent variable'. F number in this program depends on radius_of_curvature divided by ( 2 times mirror_diameter ). The radius_of_curvature is Ro, radius of curvature at the mirror center.
'Secondary Diameter / Prime Focus to Tube Center'
Secondary Diameter is active for positive entrees.
Prime Focus to Tube Center is active for negative entrees.
View the two frame animation, click on thumbnail at right.
Prime focus to tube center presumes a Newtonian telescope with a diagonal. The negative entree here is used to determine the minor axis dimension of the diagonal mirror.
'Center Obstruction Diameter / Diagonal Minor Axis'
'Center Obstruction Diameter / Diagonal Minor Axis' is a 'dependant variable'.
Center obstruction diameter and diagonal minor axis are the same dimension in this program. The only difference is in the way in which they are calculated.'Center Obstruction Diameter' merely echoes 'Secondary Diameter'.
'Diagonal Minor Axis' equals ( 'Prime Focus to Tube Center' divided by F number ) plus 1/2 inch. See alt_21.htm.
Page One Right Side
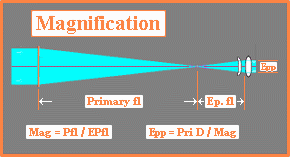
'Eyepiece Focal Length'
The 'Eyepiece Focal Length' data display and entry works the same as the 'Mirror Diameter' data display and entry. Magnification and exit pupil depend on eyepiece focal length.
'Magnification'
'Magnification' depends on eyepiece_focal_length and raduis_of_curvature. Magnification = (raduis_of_curvature / 2) / eyepiece_focal_length.
'Exit Pupil'
'Exit Pupil' depends on eyepiece_focal_length, raduis_of_curvature and mirror_diameter.
exit_pupil = mirror_diameter / magnification.
Right mouse click to change length units.

|
|
|
'Caustic c key'
The caustic display depends on mirror diameter, radius of curvature, mirror percent zone and whether or not the light source on the tester moves with the knife edge.
See: Prepare a table of Caustic X and Y Values for the test described in ATM Book Three
Data Entry Buttons
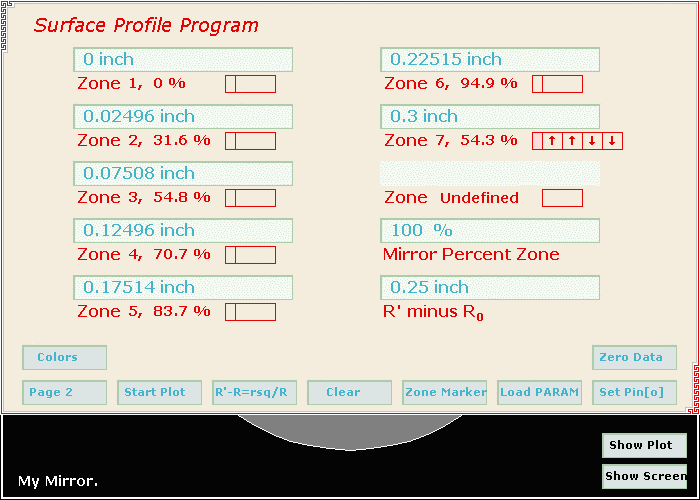
Page Two 'Zone 1', 'Zone 2', 'Zone 3', ...
Zones are also referred to as 'Marker Pins' or 'Zone Markers'. There are nine marker pins. Marker pin [0] is not set from a data entry button. The remaining marker pins [1], [2], [3], [4], [5], [6], [7], and [8] are set on page two.
Each marker pin has two numbers, percent and data value. In addition there is a focus pointer so that none or one of the marker pins has the focus. To obtain the focus for a pin hover the mouse at the left edge of the small rectangle below a data entry box. To change the radius for a pin click in the right area of the rectangle. Marker pins with radii set less than zero are defined as 'undefined'. It is still possible to change their radii by clicking in the rectangle as shown in the picture at right. With page two selected click on the 'Zone Marker' button. The silhouette of the mirror is visible on the black image. The marker pins can also be adjusted in the silhouette image. In addition clicking the mouse on pin[0] will set it to less than zero radii.
If there happens to be a pin at zero percent or 104 percent clicking on that pin will set it to less than zero radii.
The significance of a pin at zero percent or 104 percent in this case is that the 'Set pin[o]' button will set pins to those radii.
If two pins are set close together or at very different data settings the curve fitting method will not be able to fit a curve. For the details of how this takes place see: viewing_surf_functionality.htm or zSurf_Java.txt. The condition draws an 'alert line' at L1.
In the animation picture at right pin[7] has been set very close to pin[3]. The program detects that the slope between the two pins is too steep and turns off the curve smoother and turns on the angle lines. The cyan line is the slope from this pin to the next pin. The yellow line is the slope from the previous pin to this pin. And the red line is the bisector of those lines.
'R' Minus Ro''R' minus Ro' represents the difference between the radius_of_curvature at the mirror's center and radius_of_curvature_xy at 'Mirror Percent Zone'. The radius_of_curvature_xy of a mirror zone minus the radius_of_curvature of the mirror center is needed as a reference value when doing a knife edge test.
The value of 'R' minus Ro' at percent_zone depends on the function selected with the function selector button. Since functions other than r_sq / 2R can be selected it is possible to obtain knife edge references for non parabolic mirrors.
Data Entry Buttons
Starward and Surface 'Starward and Surface Plot Scale'
The plot drawn by the formula parser when 'Start Plot' is pressed and the plot of the mirror in cross section at the bottom of the plot board are not affected by 'Plot Scale'.
Push Buttons 'Colors'
The 'Colors' button when pressed will change the plotting color. There are six colors available for the Surf display. Each color has a light shade and a dark shade making a total of 12.
The last color in the Surf program is a user defined color. To change the user defined color you must edit a PARAM in the .html file. You can use Microsoft Paintbrush to find the RGB , red, green and blue components of your favorite color. To make your favorite color ready when the program starts without selecting there is another PARAM. If you don't like colors you can also edit a PARAM in the .html file.
Dark Shade Light Shade 0 0 0 255
1 0 200 0
2 0 0 0
3 230 60 60
4 220 50 220
5 255 90 90
5P 200 30 300 190 190 255
1 150 255 150
2 192 192 192
3 255 160 160
4 255 160 255
5 255 200 200 zSurf_Java.txt
5P 236 180 180 zSurf_Java.txt
'Page One / Page Two Selector'
'Start Plot'
The 'Start Plot' button is pressed after we have set up our mirror's parameters. While the plot is in progress there is a high usage of your computer's processor. It is possible to stop the plot using the 'Clear' button but it may take a while. If you can't wait press 'Ctr, Alt and Del at the same time. ( Hope you had saved that CAD drawing before you started. ) The processing time is less of a factor on newer computers.
' R' minus Ro = some function of r '
The 'R' minus Ro' button can select five different functions. The program initializes with the
r_squared / 2R function. Four 'left mouse click' will get you to function five, the R' = Ro function. If R' = Ro we have a sphere. The other three function selections are a bit more complicated. The functions used for the other three functions are specified as PARAM in the web page. This Surf Program is capable of parsing the math formulas in the applet PARAM. If you view the web page HTML code you will see the three PARAMs:
PARAM NAME=function1
PARAM NAME=function2
PARAM NAME=function3The function you can put into the <PARAM NAME=function(n) Value=" " > is similar to the function you would use in a line of BASIC code. The function always returns R' minus Ro. r placed into the function is evaluated as the current r(xy) for the zone. R placed into the function is evaluated as the radius of curvature of the mirror center. Operators available to the function parser. Other operators or alphanumeric characters will be ignored.
Since the operators can be used in an almost infinite number of combinations we supplied the program with a viewer for the function parser. Using the viewer you can find if the parser is doing what is expected.
The viewer for the parser is controlled by 'right mouse click' on the function selector button.
If 'right mouse click' is unavailable then put the mouse pointer over the function button and press \We will be making a calculation for each 'screen pixel' of one radius line or 400 calculations. ( Actually the calculations extend to 440. ) The mirror radius is always normalized to 200 pixels for the formula parser as was true in the Ronchi/Foucault Program. Each plot in the Surf Program represents 1/2 pixel on the 0 to 200 pixel radius. Since the Surf program doubles the horizontal plot scale to 400 pixels it is necessary to multiply the parser horizontal output by two for plotting on the white plot board. The function parser will repeat the parsing for each of these 440 pixels. If we slow the process down enough to see the parsing for one pixel then its obvious that it will take longer than we want to wait for the entire process to finish. So the 'right mouse click' not only turns on the parsing viewing but also controls the speed of the parser. If we want fast completion then we will plot 40 'count' parses to an off screen image before returning the computers processor for screen display and button and keyboard scan. During the 40 'count' the applet is locked up.
control button frame color 'count' Time delayed in milliseconds. Show the calculations 0 40 0 false 1 5 0 false 2 1 0 true 3 1 500 true 4 1 4000 true If you want the plot to finish fast select for the button frame color. Then if you want to quit during mid plot 'left mouse click' on the 'Clear' button and in a short time the plotting will stop and clear. The time it takes to clear depends on the computers speed and the complexity of the formula that is being parsed.
If you want to see the plotting and may want to clear the plot early then select for the button frame color before hitting 'Start Plot'. With selected the processor will check for user input after every 5 plots. Then you can cycle through , , and back to using 'right mouse click' or \ . Every 'right mouse click' halts plotting for 2 seconds to allow more user input. For example another 'right mouse click' within the 2 seconds to get past . If you are in and can't get out then 'left mouse click' anywhere on the applet background and after a while the program will change to . Plotting time is more of an issue with the Ronchi/Foucault program where 31415 pixels are calculated.There are sample formula that you can paste into your copy of the surf.html file using Notepad or some other .txt ( text file) editor. Then you can browse the surf.html file with your browser to test the formulas. To open an .html web page file with Notepad select 'File', 'Open', then select 'All Files ( *.* ) then you will be able to see the surf.html file in the selection box. If you have copied the 'surf_prog' folder from the 'Telescope Program' C/D to your hard drive it is likely that all the files have been set to 'read only'. To change the 'read only' attribute open Windows Explorer and uncheck the read only attribute in the properties box.
The formula parser has several error codes that it will announce with a bell when it finds an error in a formula. The error description will appear briefly in the browser status bar. When trying to test your formula it is well to spread the formula out in the available variable space to make viewing the parsing easier. If there is a problem making the parser parse the formula correctly try rearranging the formula or adding parentheses. Cycle through the formulas with the 'R' minus Ro' selector button without starting the plot and make sure there is some number in the 'R' - Ro' data box for your formula. Use a computer that you can safely re-boot while experimenting with different formula.
'Clear'
The 'Clear' button has two steps.
The first press allows you to see behind the cream colored legend slide without removing the data entry buttons from the display. The frame for the 'Clear' button will be red after the first press. Press the 'Esc' key to cancel and return the legend for the data entry buttons.
The second press is similar to clear on a calculator. Both the plot board and the mirror silhouette in the black image will be cleared. The second press will reset the program but leave the data entries you have made for your mirror.
The 'Clear' button state affects the operation of the 'Show Screen' button. With the cream colored legend slide in view the 'Show Screen' button turns off and on both the legend slide and the data entry buttons. With the legend slide not visible the 'Show Screen' button turns on and off the data entry buttons.
Pressing the 'Ctrl' key will arm the 'Clear' button to bypass the Surf program. Pressing the 'Esc' key will cancel the pressing of the 'Ctrl' key. When the program is bypassed by pressing the 'Ctrl' key then the 'Clear' button the program 'thread' is stopped and the graphics method will only display a small image to the screen with the message "Ron program is bypassed". The only way to restart the Applet is to use 'Refresh' on the browser or select another .htm page and then use the back button on the browser. The program will then re-initialize using the same Java code that had been loaded previously. On initialization all the program variables are reset and the PARAM s reloaded from the surf.html file. While the Surf program is in the bypass mode it will use almost no processor time. This is sometimes useful on slower computers.
'Zone Markers'
The 'Zone Markers' has four states;
(1) Off
(2) User defined zone markers
(3)User defined zone markers with a legend for making a zone stick or zone mask.
(4)User defined zone markers with a legend for making a zone stick or zone mask.
Selection 3 and selection 4 are very similar. In selection 4 the mouse menu for selecting pin radius is plotted last, on top of the zone pin legend box.The 'Zone Markers' display allows the user to adjust the marker pins radii when data entry page 2 is selected. To save time, if the plot board is visible and 'Zone Markers' is pressed the plot board will be turned off and data page 2 selected automatically.
The 'Zone Markers' is cycled through the states by pressing the 'Zone Markers' button.
The 'Zone Markers' may be cycled backwards through the 'Zone Markers' states by pressing 'Esc'. When the 'Off' state is reached the 'Esc' key will resume its normal program function. The zone markers can be cycled at any time except while plotting is in progress.The User defined zones are read from the surf.html file when the program initializes.
Changing the user defined zones:
Changing the initialization setting of the zone pins is done by editing the surf.html file before starting the 'Surf Applet'. See the annotated surf.htm file.In the 'Surf Program' it is also possible to change the zone marker radii while the program is running. Refer to markers.htm.
'Load PARAM'
If you have changed the parameters in the data entry buttons and decide you want the setting as they were then press 'Load PARAM'. When the program initializes ( begins ) it reads various parameters from the surf.html file. When you press 'Load PARAM' the program will re initialize the data entry buttons using the PARAM s in the .html file. If you edit the PARAM s in the surf.html file using Notepad outside the browser then hit 'Load PARAM' the new PARAM s you put in the surf.html file will not be used until you hit 'Refresh' on the browser. This is because the browser is using a copy of the original surf.html file.
'Load PARAM' does not reload all the PARAM s, only 'Mirror Diameter', 'Radius of Curvature', 'Secondary diameter/ Prime Focus to Tube Center' and the users measured starward knife edge data entrees. 'Load PARAM' also draws alert lines.
'Set Pin[o]'
'Set Pin[o]' is covered in at least three places. Zone 1', 'Zone 2', 'Zone 3', ..., on the procedures.htm page and on the plot_board.htm page. The [] symbol is used in programming to indicate the compiler is to allocate memory space for an array. [n] used enclosing a number, the number is used to point to one element of an array. For instance marker_pin_pixels[ 0 ] refers to the 0 location in the array marker_pin_pixels. At location 0 in array marker_pin_pixels we find the current radius of marker pin #zero.
When marker 'Set Pin[o]' is pressed the marker_pin_pixels[ 0 ] will be set by the program so the mirror area inside of marker pin 0 is equal to the mirror area outside of marker pin 0. This location would be 70.7 percent unless there is a diagonal shadow.
The starward data entry for marker pin [0] is not set from a starward data entry button. In this program the starward data for pin [0] is set to the curve after the curve has been fit to the other 8 data pins.
The second press of 'Set Pin[o]' will deactivate pin 0 by setting marker_pin_pixels[ 0 ] to a negative number.
The 'Set Pin[o]' method has two other procedures attached to it.
After setting pin #0 the method will calculate the conic for the curve.
And finally, a function which can be bypassed by holding down the ' ' = space bar on the keyboard. The final function will set pins at 0 percent and 104 percent. But only if there is not already pins at those locations and only if there are extra unused pin. For more information refer to procedures.htm and for a listing of the error messages to: zSurf_Java.txt.
'Zero Data'
There are two 'starward' arrays that can be zeroed and five mirror surface arrays that can be zeroed. Starward meaning along the mirrors longitudinal axis. ( Knife edge data. ) The term zeroed in reference to an array usually means setting all of its elements to zero. That definition is not correct in the Surf program. Zeroed in the Surf program means setting one array element to zero and shifting all the other array elements by the same amount, thus moving the curve up or down with reference to the zero line on the plot board. The array element that is set to zero is the array element closest to which ever marker pin has the focus. The marker pin with focus is drawn in a different color than the other pins.
Zeroing the starward arrays will not affect the operation of the starward to surface transform method because the starward to surface transform method will always zero a copy of the array such that the element at the mirror center is zero.
Zeroing the surface arrays could affect the operation of the transform method because the transform correction arrays might be miss set. For this reason the method that calibrates the transform correction arrays is locked out when surface arrays are zeroed. Best to zero the arrays after the transform method is already calibrated.
The plot board is generally plotting the result of subtracting a reference array from an unknown array. The 'Zero Data' method will zero only those two arrays leaving the other arrays as they were. Which arrays are zeroed depends on which display is selected on the plot board. Zeroing arrays will draw blue alert lines on the plot board.
'Show Plot'
The 'Show Plot' button turns on and off the white plot board. If the cream colored legend image is displayed over the top of the plot board then only a tiny bit of the plot board will appear and disappear when 'Show Plot' is cycled. To see the black board with the mirror silhouette the plot board will need to be turned off.
'Show Screen'
The 'Show Screen' button operation is affected by the 'Clear' button. With the cream colored legend slide showing one click shows the images behind the cream legends. With the cream legends gone but the data entry buttons still visible the 'Show Screen' button turns off the data entry buttons. The selection buttons at the bottom of the plot board stay on when the plot board is visible. With the plot board off the 'Show Screen' button will turn off all the buttons.
The second press of 'Show Screen' will reverse the first press unless some other display buttons have been pressed in the mean time.
If the entire black silhouette screen is visible the 'Show Screen' button is then black if the mouse is not over it and shows 'Show Menu' or 'Show Button' if the mouse is over it.
Plot Board Buttons and the Wedge Display
Plot Board Buttons and the wedge display are explained in the file plot_board.htm.
Active Keys on the Keyboard
The escape key. Generally used to cancel some program mode that we selected by mistake:
Esc
Number Keys for Data Entry:
Pressing a number key concatenates that number to the data entry array and displays the changed data entry array. Back space removes a number. ' ' = = 'Space Bar' removes all the numbers but leaves the minus sign unchanged.
1 2 3 4 5 6 7 8 9 0 - . backspace and the 'Space Bar' and the Enter key.
Substitute for 'Right Mouse Button' click:
\
On your tester does the light source move with the knife edge or grating or is the light source stationary and only the knife edge move. If the light source is stationary the knife edge or grating must move twice as far. Sets alert lines.
Shift Y Light source moves with the grating.
Shift N Light source does not move with the grating.
You can edit a PARAM in the .html file to make the program initialize either Y or N.
To change the value of B in a formula loaded from the .html page press b on the keyboard and enter a value for B in the 'Constant B' data entry. B is used in the R' minus Ro formula. Pressing Esc or b a second time cancels the 'constant_B' data entry box.
b ( or B )
Display the values for doing a caustic test.
c
Turn on and off the wedge display. Also note
w
Apply or remove the circumference weighting for plot board buttons L4 and L5.
'o' produces a normalized circumference weighting that is comparable to peak to valley readings. 'O' produces weighting proportional to surface area. ( 2rx * pi )o or O
Answer the question when the box at right appears. Ref1 Ref2
t f
Test the transform method while bypassing a transform correction. Sets alert lines. Ref
Z and z to cancel
For active keys in the 'View Arrays' mode see plotboard.htm.
The s key can be used to view program functionality in the
curve_fit_to_entered_data_points( ) and
starward_to_surface_transform( ) methods.
Press the Esc key to cancel or the s key to turn off the sort display then the Esc key to cancel. The 'Clear' button can also cancel this display. If two pins are too close together Esc will only work until curve_fit_to_entered_data_points( ) method is called again. Actuation affects the 'alert lines'.
s
To change the units of measure ( inches.. meters ) right mouse click on a data entry button.
While in the units of measure mode you can start a screen saver display similar to 'Pong'.
While the units of measure box is visible press:Shift ~
View the data arrays that hold the button properties:
Shift ?
Scroll through the button data array properties ( left or right ):
< > ( , or . )
Show the button outlines while viewing the button properties.
\ ( or 'right mouse click' )
Cancel view the data arrays that hold the button properties:
Request program bypass:
'Ctrl' followed by the 'Clear' button will stop the program from running. When the program is bypassed the Java code remains in memory but is inactive. 'Refresh' on the browser will re start the program and re initialize most variables. You can also press the 'Ctrl' key to suspend plotting then press the 'Esc' key to resume as before.Ctrl
The above keys are part of the Surf Applet program. While the program is running in a browser there are other keys such as PgUp and PgDn that the browser will use. In Microsoft Internet Explorer if you 'Left Mouse Click' on the web page in an area that is not on the Applet then the browser keys will be active. If you mouse click over the Applet then the Applet keys will be active.
When changing browser settings it may be less confusing to use the mouse on the browser menu bars.
Explanation of the Surf Applet Source Code
Notes on Java Source Code
What is a Java method?
'method' has the same meaning is Java as 'function' had in the C programming language. Below are two Java methods:

static final boolean hungry = true;
static boolean calling_method()
{
if( hungry )
make_ice_cream();
else
return false;
return
true;
}
static void make_ice_cream()
{
string ice = "Ice";
string cream = "cream";
g_graphic_for_my_image.drawString(" "+ice+"
"+cream+", yum ", int__to_right, int__down );
}
The 'for loop'
static final
double initial_elevation = 10;
static double elevation = initial_elevation;
static int number_of_steps = 11;
static void method_with_a_for_loop()
{
double step_rise = 7.5;
for( int step = 0; step
< number_of_steps; step++ )
{
elevation = elevation + step_rise;
if( top_of_steps_reached( elevation ) )
break;
}
}
static final double second_floor_elevation = 120;
static boolean top_of_steps_reached( double this_level )
{
if( this_level >= second_floor_elevation )
return true
return false;
}
To view more Java methods look in the text file:
Understanding how arrays are instantiated in Java
An array is used to store a series of,
usually related, numbers in the computers memory. Such as a table of
ocean tide at various times of day for example.
Lets use an analogy to help us visualize a computer array.
Think of a post office with post office boxes. Each box has a number to distinguish
that box from all the other boxes. That number cannot be calculated from
the name of a person on a letter which might happen to be in that
box. And there is another number used to distinguish this post
office from all the other post offices.
First lets define some values.
static public final int total_number_of_post_office_boxes = 1024;
static private int my_post_office_box = 101; // Comment, = is 'assignment operator'
static final String my_name = "Hey ya";
static int a_test_box_number = 2000;
So now lets instantiate an array.
public static String San_Francisco_94125[] = null;
Analogy, a location is reserved for the construction of a post office at San Francisco.
San_Francisco_94125[] = new String[ total_number_of_post_office_boxes ];
Analogy, the post office is constructed and it has 1024 post office boxes.
San_Francisco_94125[ my_post_office_box ] = my_name;
Analogy, put the letter addressed to Hey ya into my post office box at 94125.
Now lets consider abnormal conditions. ( errors )
San_Francisco_94125[ 2000 ] = my_name;
Well there is no box 2000 so how do we handle that?
In our analogy the postal worker would return the letter.
In the computer there are at least two options. The computer could write
"Hey ya" to to the memory location where post office box 2000 would
have been if the post office had 2000 boxes. But later on when the
computer processor is expecting a binary instruction from 2000 it will receive
"Hey ya" instead. This will usually cause the computer to
crash. Or even worse produce erroneous results.
So the system programmers have written the code to 'throw' an out of bounds 'exception' in
this case and the exception must be handled otherwise my program will be
closed by the operating system.
San_Francisco_94125 = null;
San_Francisco_94125[ my_post_office_box ] = my_name;
There is no place for
"Hey ya" to be placed because 94125 has be torn down.
Traumatic in our analogy but of little import in the context of our program so
long as we check to see if the post office is there before placing
"Hey ya" in it.
static main() // Comment, Calling function:
'main'.
{
if( my_mail_method( a_test_box_number
) )
g_graphic_for_my_image.drawString("
"+my_name+", you have a letter! ", int__to_right, int__further_down );
}
static boolean my_mail_method( int
box_number_on_this_letter ) // The variable in parentheses
is
// called a 'parameter'.
{
boolean return_value = true;
if( San_Francisco_94125 !=
null ) //
!= means: 'not equal'?
{
if( box_number_on_this_letter <
total_number_of_post_office_boxes
) // < is 'less than'?
{
if(
box_number_on_this_letter == my_post_office_box
) // == means values are equal?
San_Francisco_94125[ my_post_office_box ] = my_name;
else
return_value = false;
}
else
return_value = false;
}
else
return_value = false;
return( return_value );
}
Analogy, if there is a post office at 94125 and if the
post office box number on my letter
specifies a box that exists at that post office
then put the letter in my PO box.
So now we have kept the possible problems in our program inside the program to be
handled in the program and not thrown back to the system.
static,
While the program is running this memory location is always reserved for this
variable,
or, in our analogy, will be there until the end of time.
public, Known to the entire program, or known to the public in our analogy.
final,
While the program is running this number is never to be changed.
Analogy, a constant such as pi.
int,
an integer. Cannot contain any values to the right of the decimal point.
( no fractional values )
The
systems programmer will know that an int will require a certain specified
amount of
memory in his operating system.
total_number_of_post_office_boxes,
this is the label for our constant ( or variable ).
We could just as easily called it mystical01 or zY but
total_number_of_post_office_boxes seems to make more sense.
1024,
The program will prepare an int type number with the value of 1024 and load it
into the
memory location now assigned to total_number_of_post_office_boxes.
private,
Known only inside this 'class' or this method and not visible to the program
in general.
In our analogy, not relevant to a box holder at some other post office.
'Object oriented Programming'
g_graphic_for_my_image.drawString( " ", int__to_right, int__down );
Java language comes with a 'class' called graphic. There is a special graphic that refers to your computer's screen memory which is handled by the operating system. In this case however g_graphic_for_my_image refers to an image which exists only in my application. Possibly im_my_image would be a good label for my image.
Somewhere in my Java program im_my_image has been created and an object of the graphics class attached to that image. The graphic class contains a method called drawString( " " ). Since g_graphic_for_my_image is an object of the graphic class g_graphic_for_my_image contains a copy of the drawString( " " ) method.