An atom has a central nucleus and electrons in resonant shells around the nucleus. Heavier atoms such as gold have more shells than lighter atoms such as carbon. Flooding an atom with brilliant light of all colors the electrons begin to jump to higher energy shells. When the excitation, which could be light or electron bombardment, is removed the electrons begin to jump back to lower energy shells. These jumps between shells release 'quanta' of energy. Rather than light being released as in a rainbow the light is released at precise frequencies or colors. The precise colors or spectral lines change to other spectral lines if the excitation energy is increased or decreased. The spectral lines are of a very precise frequency and each element has it's own set of spectral lines. The spectral lines can be used to measure chemical composition, energy level and Doppler shift. See reference below.
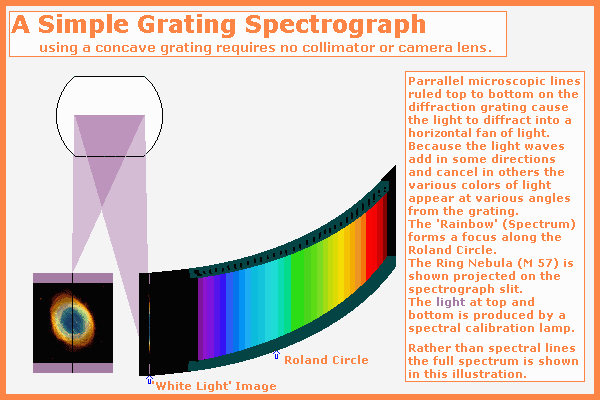
Returning to our simple spectrograph as shown above we see the ring nebula focused on the slit by the telescope primary mirror. Widening the slit will allow more light to enter but will blur the spectral lines so that lines that are close may be blurred together. Most spectrographs have a camera focused on the slit so the astronomer can tell which portion of the sky is entering the slit.
The Original Diffraction Grating
The diffraction
grating effect was noticed when looking through fine cloth at a point light
source. In 1820 Fraunhofer made the first
diffraction grating by winding thin wire over two fine screws of equal pitch
kept an inch or two apart by bars of metal. Using these wire gratings Fraunhofer
was able to measure the wave length of yellow sodium light. 
Modern gratings are made by ruling lines on glass using a diamond point and more recently good plastic gratings have been molded from glass originals.
More about the Spectrograph
For more precise spectral measurements better spectral resolution is required. Light from distant galaxies is faint to image and putting the light through the spectrograph adds to the problem. Large telescope primaries and large diffraction gratings are required. The telescope guidance system must be precise and stable to be useable by the astronomer.
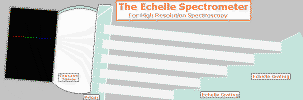
The Echelle High Resolution Spectrometer
Visit the echelle simulation at right then return for more explanation.
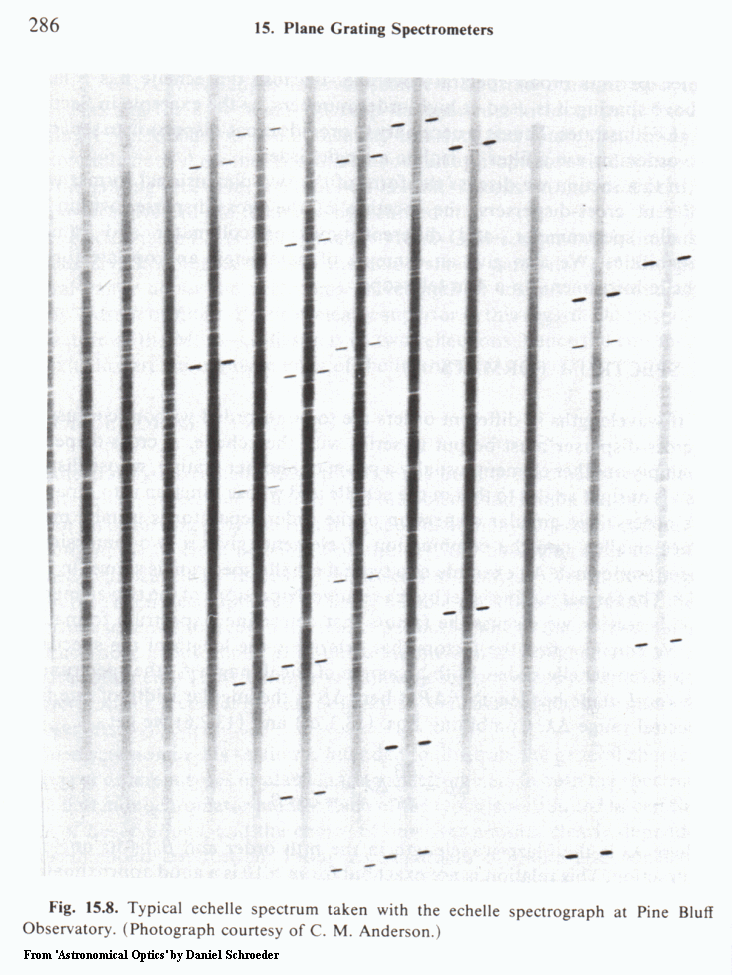
Note that as the light is spread more in a high resolution spectrograph more than one wave length of light will add at a particular angle from the grating. The different colors at the same angle are called 'orders'. First order, second order, etc. The frequency of the different orders are 'harmonics' of one another. Harmonic frequencies are frequencies that are related mathematically as common fractions are related by a 'common denominator'. To separate the orders from one another a second low dispersion grating or prism is required.
The echelle spectrometer shown uses a lens for the collimator and a prism for cross dispersion. Prisms are not too popular in modern spectroscopy because a prism spreads the blue light much more than the red light. The prism requires a 'non linear' scale when reading spectral lines. Sometimes the orders can be isolated with color filters. Modern multilayer dielectric filters can be designed to isolate particular bands of color while rejecting other color bands.
Below is the layout for one type of echelle spectrometer taken from the book 'Astronomical Optics' by Daniel J. Schroeder.
Build and Calibrate your own CCD Spectrograph
'Sky and Telescope' July, 2000, page 125 has an article about an amateur built Spectrograph.
'The Birth of Celestial Spectroscopy'
'Starlight Detectives', 'Sky and Telescope' , August 2004, page 44.