|
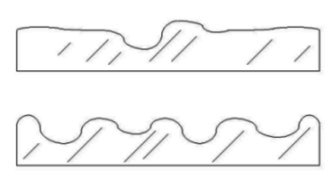
A Better Method of Measuring Optical Performance Move over P-V and make way for Strehl The amateur astronomical community has become comfortable with a method of rating optical quality that is, quite frankly, a very poor method indeed. It's time to drop the old Peak to Valley (P-V) criterion and use a performance criterion common to the professional, commercial optical world, the Strehl ratio. The Strehl ratio has been in regular use for many years and will only be new to many involved in amateur astronomy. The Strehl ratio is really quite easy to relate to and will tell us a lot more about the performance of an optic than a the P-V rating. Amateur astronomers would benefit greatly by using a performance criterion that accurately and rationally expresses a particularly important measure of optical performance, rather than a statement of figure quality that is, despite its convenient simplicity, ultimately unconnected to performance. The Strehl ratio is simple to understand, as equally simple as the current P-V standard, yet far more accurate and comprehensive in intuitively describing the condition of an optical wavefront. Although the mathematics involved in the fundamental makeup of the Strehl ratio may be complex, they can be rather easily explained in concept. In the end, the Strehl ratio may be far more appealing than the old P-V standard when people become comfortable with it. The amateur astronomical world is rapidly moving far beyond the world that existed 10 or 15 years ago. Amateur astronomers are demanding a new excellence in optical performance and those demands extend themselves directly to the makers of optical components. They are continuing to ask us for increasingly higher quality optics. Unfortunately, these demands are being couched in terms that make the production of such optics virtually impossible. It was one thing when the standard was lambda/4 (1/4 wave) but quite another when the standard is lambda/10. Human nature being what it is, claims become increasingly exaggerated; particularly when the standard utilized has no intuitive grounding in reality. If one person can produce lambda/10 optics then another optician, far more skilled, can certainly produce lambda/20. And if he can do that, the next wunderkind can produce lambda/40. And on and on. But if you are wondering where this all ends, perhaps a more important question is what it all means. And can anybody actually achieve such numbers in terms of the common standard of peak to valley. The significant advantage of the Strehl ratio is that it is a measure of optical excellence in terms of theoretical performance results, rather than an expression of the physical surface or the shape of the wavefront. It is a complete statement, in terms of a single number, that describes probably the most significant measure of an optic's performance. In very simple terms, the Strehl ratio is an expression of the amount of light contained within the Airy disk as a percentage of the theoretical maximum that would be contained within the disk with a perfect optical system. More correctly stated, it is the measure of the fractional drop in the peak of the Airy disk as a function of wavefront error. Strehl performance is usually expressed as a range of numbers from 1 to 0, more rarely from 100% to 0%. A perfect system is 1, a completely imperfect system is 0, and acceptable standards occur somewhere in between. So, if someone says you have a mirror that has a Strehl of .95 you understand that 95 percent of the theoretical maximum amount of light is going where it should go. And 5 percent of that light is going into the surrounding rings (mostly and most noticeably into the first order ring) and contributing to a reduction in contrast. It's as simple as that. This is a concept that can be easily understood by anyone once appropriate parameters have been set and is a completely honest and accurate representation of optical performance. But what are the parameters? What should we expect from a really good optical system? Is .8 enough? Or should it be .9 or .95? And how do these numbers relate, even approximately, to current peak to valley standards? Perhaps the best way to answer this question is to explore of the various commonly understood parameters for optical excellence and see how they translate into a Strehl ratio. The Peak to Valley Criterion To demonstrate the weakness of the peak to valley method of measurement, the following example is provided. The picture below is an exaggerated cross-sectional representation of two hypothetical mirrors. Each mirror is rated at lambda/10, peak to valley. Each mirror has a maximum and minimum wavefront error, that when combined, equal a total amplitude error of .10 wavelength of light. Yet, these mirrors are two totally different optical surfaces and each will yield a vastly different wave-form. At a casual glance, and without the benefit of sophisticated analysis, which one would you rather have?
The answer is obvious. And so is the inadequacy of the peak to valley methodology as a measure of optical quality. It looks at only two points, the high and low, and ignores all that lies between. Important issues such as roughness are totally ignored while a very small high or low point are exaggerated totally out of proportion to their significance. A mirror showing a peak to valley value of lambda/2.5 (.4 wave) might in fact be an extremely good mirror with the vast majority of its surface at better than lambda/10 and very smooth. The reason that the peak to valley criterion is so popular is due to a combination of factors that have transpired over the years. When testing with a knife edge or a Ronchi screen, many errors that would show up in interferometric testing are simply masked or subdued. This is actually not a bad thing during the course of producing an optic since knife edge and Ronchi testing adequately reveal correction error and zones, which are the most serious problems encountered during figuring if asymmetries such as astigmatism can be assumed to be under control via good shop practices. For example, false astigmatism generated by supporting an optic on its edge is completely unseen in the knife edge and Ronchi tests and allows the optician to work without confusion. Put under the more discerning light of an interferometer, the same optic, held the same way, might show a large amount of astigmatism which is not actually a permanent part of the optic and disappears when the mirror is properly supported in the telescope. When estimates of surface error are made with knife edge and Ronchi tests, largely by measuring zones (which are relatively speaking fairly broad areas), a peak to valley criterion is understandable and makes sense. In fact, reducing the peak to valley error to negligible levels using this test will usually assure a fine mirror. But under the scrutiny of the interferometer, which measures very small areas over the entire surface and not just a cross sectional slice through the middle, a more complete analysis that integrates the results of many measures is necessary. The essential point here is that the knife edge and Ronchi tests are fundamentally different in their nature and application from that of interferometery. Today's concept of measurement is based upon the application of interferometry. Therefore, the new test demands a new method of measurement appropriate to that test. Also, users of the knife edge and Ronchi tests make a number of intuitive judgments above and beyond mere peak to valley wavefront estimates. The optician also judges the surface in terms of roughness and small zonal irregularities which are usually reported as separate items in his analysis. A typical comment might be, "1/10 wave, peak to valley, but rough and with a small zone near the center." This is substantially different that a blanket "1/10 wave" statement and injects auxiliary mitigating statements that would not be part of an interferometric peak to valley wavefront analysis. A typical interferometric analysis, aside from a peak to valley wavefront analysis would also give indications of RMS wavefront error as well as a Strehl ratio. And these might show a significantly better optic. The RMS or Root Mean Squared Criterion The RMS system of measurement is based upon the principal of measuring a substantial amount of the optic's surface at many points and then arriving at a single number that is a statistical measure of the departure of the surface from the ideal form. This technique puts into proper perspective any isolated areas which may be in themselves highly deviated from the general surface. The name Root Mean Squared is derived from the algorithm used to arrive at the final statistic. This algorithm actually arrives at something known as Standard Deviation, but because in optics the mean is always removed from the error being rated, the RMS will always equal the standard deviation. The process involves taking a set of readings over the surface and then adjusting these readings equally, positively or negatively, until the arithmetic mean of the readings are equal zero. Likewise, tilts are removed when considering optics, since tilts only represent a displacement of the image, not a degradation. Once this is accomplished, all of the surface readings are then individually squared, the squared readings are then averaged, and a square root is taken of the average. For example, let's say that the following hypothetical ten readings have been taken and represent deviations in wavefront of an optic (see chart below). For illustrative purposes I have made the second five readings the negative of the first five readings so that the average of the readings will equal zero. It is immediately observed that with the exception of two 1/5 wave readings, 80% of the surface appears to hover around +/- 1/10th of a wave (1/5 wave, P-V), with 20% of the surface at .4 wave. Yet, if a strict peak to valley criterion is used we arrive at a reading for this mirror of .4 wave. Applying a RMS analysis we arrive at the value of .125 or about 1/8 wave.
Arithmetic Mean: 0 But does this mean that this is a 1/8 wave optic in any sense that one might ordinarily think? After all, most people see "1/8 wave" and think, "peak to valley". This is why the use of RMS as a sole measure of accuracy is dangerous. While the amateur astronomical optical world has determined that 1/8 wave and 1/10 wave are desirable peak to valley standards for high quality optics, no such commonly adopted standard has ever been developed for RMS. Notwithstanding the fact that Rayleigh implied 0.074, and Marechal and Marachal explicitly stated it, much confusion still remains in the mind of the purchaser. The problem lies in the fact that the RMS numbers are inherently more arbitrary and difficult to hang on to than P-V standards, which at least have some basis in intuitive reasoning. One can imagine a peak and a valley but not so easily a standard deviation. Suggesting that 1/10 wave P-V might be equivalent to about 1/35 wave RMS is likely not to stick in the mind of a telescope buyer, but that actually is the approximate relationship when talking about correction error, though no real relationship actually exists The Strehl Ratio To reiterate, the Strehl ratio is a measure of optical excellence in terms of theoretical performance results rather than an expression of the physical surface or the shape of the wavefront, as in P-V or RMS. The Strehl ratio is an expression of the amount of light contained within the Airy disk as a percentage of the theoretical maximum that would be contained within the disk with a perfect optical system. It is the measure of the fractional drop in the peak of the Airy disk as a function of wavefront error with a 1 Strehl being perfection and anything less than 1 less than perfection. The Airy disk of an unobstructed objective will contain a maximum of 83.8% of the energy from that star entering the objective. The first order ring will contain 7.2% of the light, the second order ring 2.8%, and so on, diminishing monotonically with each successive ring. Usually only the first ring is clearly visible on a steady night. Basically, what it's all about is getting as much of the light into the Airy disk as is possible. Arguments arise about whether additional light in the first order ring aids in the separating of double stars, but for all practical purposes the more light in the Airy disk, the better off you are. Up to this point, we have been discussing wavefront deviations related to large figuring errors, but other factors make major contributions to optical performance as well. One of these factors is surface roughness. With knife edge and Ronchi testing surface roughness can only be judged intuitively by a skilled worker making visual estimates according to his experience. But with interferometry, roughness can actually be measured. The ability to measure roughness in a quantitative way, along with all other aberrations, is what makes interferometry and its associated analysis tools so powerful in determining what constitutes the quality of an optic. Analyzing an optic by measuring a large number of data points (several hundred) results in an RMS measurement that contains the data necessary to calculate the Strehl ratio and the impact of roughness on the overall performance of an optic. The great value of the Strehl ratio is that it expresses the powerful aspects of the RMS method in a manner that is intuitive and memorable: 1 is perfection, .8 is okay. 9. is good, .95 is extremely good. This kind of familiar and easy to remember expression of quality is essential to creating unimpeachable standards for optics. The calculation of the Strehl ratio is not particularly difficult once the RMS has been calculated. A simple approximation formula is: Strehl Ratio = 1 - (2 pi * RMS) 2 and works well for Strehls of high values. Applying this to the RMS of the hypothetical surface calculated above, using the more exact and complex formula of ((RMS * 2 * pi) 2 -/+ ) Inv Nat Log, we arrive at Strehl ratio of .383. Not very good. But why not very good? Just what is the Strehl standard? What's good? Lets examine some known standards. Quality Bench Marks Perhaps the best-known benchmark for optical quality is the Rayleigh limit, not to be confused with the Rayleigh Criterion, a measure of the ability of the telescope to separate binary stars. The Rayleigh limit basically asserts that if the wavefront reaching the eye is distorted or deformed by spherical aberration more than 1/4 wavelength of yellow-green light, the image will be perceived as degraded. Any wavefront reaching the eye having a de-formation of 1/4 wave or less will be perceived as essentially perfect. This standard has been accepted as representing a minimum standard, not the highest standard, but the minimum standard for high-quality optical performance. Recent work suggests that perceptibly better performance is had by having an optical system yielding a final wavefront through the eyepiece of 1/8 wave. This more recent perception of the need for higher quality optics has undoubtedly promoted recent passion for ultimate optics. According to Suiter (Star Testing Astronomical Telescopes, 1994, page 9) the 1/4 wave Rayleigh tolerance as related to spherical aberration causes a drop in the Strehl ratio to .8. Marechal's work (Born and Wolf 1980, page 469) with respect to the RMS statistic (the Marechal Criterion) has also shown that the Rayleigh limit can be more generally expressed as an RMS wavefront of about 1/14 (.071), yielding a Strehl ratio of .82. This applies regardless of the form of the error, as long as the RMS meets that level. But, of course, more sophisticated and experienced observers tend to require a higher level of quality, such that the total optical wavefront error should be approximately half that of the old Rayleigh limit, or about 1/8 wave P-V in the wavefront. Accepting Marechal's RMS of .071 as equivalent to Rayleigh's .25 peak to valley, at least in the spirit that ATMs use the Rayleigh limit, we arrived at the new RMS of .036 or a Strehl ratio .95 as a final 1/8 wave equivalent value. (The Rayleigh limit applies strictly to spherical aberration. Other forms of aberration yield different levels of P-V error to drop the Strehl to 0.80. This fact is, as stated earlier, a critical flaw in the P-V rating.) If we desire a final 1/8 wave accuracy for the system, and allowing a small error accumulation due to the diagonal flat and eyepiece, not to mention the eye itself, we see the derivation of the current standard of 1/10 wave for a primary mirror (objective). From this, we can establish an equivalent RMS of .028 (1/35.7). This translates into a Strehl ratio of .97. A 1/9, P-V wave accuracy would yield an RMS of .032 or a Strehl ratio of .96. Reasonable Strehl Standards From this optician's viewpoint a reasonable standard for telescopic objectives of high-quality would be those producing a Strehl ratio from at least .95 upwards (1/8 wave, P-V if all correction error) and preferably .96 (1/9 wave, P-V) with .97 (1/10 wave, P-V) as representing the best that is reasonably attainable. The purchaser of an optical system need only remember three pairs of numbers: 1/8 wave = .95, 1/9 wave = .96, 1/10 wave = .97. That's it. To make it even easier to remember, just remember that there are three important P-V values (1/8, 1/9, 1/10) and to calculate the equivalent Strehl one need only to subtract three from the wavefront denominator to yield the second number of the Strehl value. Example: 8 - 3 = 5, 1/8 wave = .95. This little shorthand device will not work across the entire wavefront/Strehl ratio range, but it will work for these three important numbers. A list of Strehls associated with reasonably encountered P-V, wavefront, values are as follows:
* Derived from 1/4 wave, P-V of spherical aberration, wavefront equaling an RMS of 1/14.05 or .071 I sincerely hope that this article generates an interest in utilizing a method of rating optics and optical systems that is not only convenient but significantly superior to those already in use. As a final note, the Strehl ratio derived from an interferometric measurement of the RMS wavefront error represents a ceiling on the attainable performance. In use, a mirror will never attain this performance, mostly because of seeing, but also because of collimation errors and errors from the other optical elements in the path. Even the steadiest nights at the best sites do not allow a system to achieve this performance, but it can come quite close.
|
|||||||||||||||||||||||||||||||||||||||||||||||||||||||||||||||||||||||||||||||||||||||||||||